How to Read Crypto Market Charts Without Feeling Lost: A Clear Guide for Beginners

Many people find it challenging to read crypto market charts because they seem complex and full of unfamiliar data. The key to understanding cryptocurrencies through charts is focusing on simple patterns and basic indicators rather than trying to analyze every detail at once. By identifying core elements like price movements, volume, and trend lines, anyone can start reading crypto charts without feeling lost.
Charts show valuable information about how cryptocurrencies perform over time, helping traders and investors make informed decisions. Recognizing clear signals in the data, such as when prices rise or fall steadily, allows users to gauge market sentiment quickly. Once someone gets comfortable with these basics, navigating more advanced chart features becomes easier.
Mastering crypto chart reading does not require memorizing every term or tool; it is about developing a practical understanding of what the visuals convey. Step by step, the confusion fades as familiarity grows, making charts a reliable resource rather than an obstacle.
Understanding Crypto Market Charts
Crypto market charts display price movements and trading activity over time. They help users analyze cryptocurrency price trends, identify patterns, and make informed decisions. Different chart types and axes provide specific insights into historical price data and market behavior.
What Are Crypto Charts and Why Do They Matter
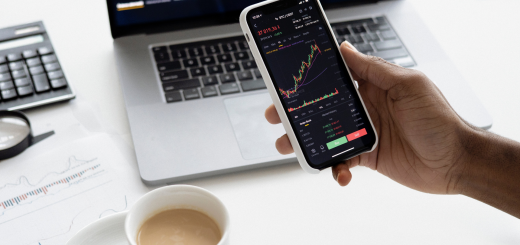
Crypto charts visualize the price and volume of cryptocurrencies like Bitcoin. These charts show data over selected time frames, from minutes to months. This helps traders spot trends, volatility, and key support or resistance levels.
Charts are essential tools on platforms like TradingView and CoinMarketCap. They provide transparency and allow users to track the real-time or historical price movements of various coins in the crypto market.
Understanding crypto price charts prevents confusion and enhances trading strategies. Without charts, evaluating market conditions would rely solely on guesswork, increasing risk.
Popular Chart Types: Line, Bar, and Candlestick
Line charts connect closing prices with a continuous line. They offer a simple view of general price direction, suitable for beginners focusing on overall trends.
Bar charts display open, high, low, and close prices for each time period. These vertical bars provide more detail about daily price volatility.
Candlestick charts are similar to bar charts but use colored rectangular bars (candles) to indicate the price range. A green (or white) candle shows price gains, while a red (or black) one indicates losses. Candlesticks reveal market sentiment and intra-period price action, making them popular among experienced traders.
Each type serves a purpose depending on the analysis depth needed. Candlestick charts are the most common in cryptocurrency trading due to their visual clarity and detailed information.
Interpreting Chart Axes and Data Points
The x-axis on crypto charts represents time intervals, which can range from seconds to months. Traders select this scale to zoom into short-term or long-term trends.
The y-axis shows cryptocurrency price values. It often uses logarithmic or linear scales, influencing how price movements appear. Logarithmic scales better represent percentage changes, especially for volatile coins like Bitcoin.
Data points include price markers such as open, high, low, and close for each interval. Volume bars below the main chart indicate how much cryptocurrency was traded during that period.
Accurately reading these axes and data points is crucial for identifying market patterns and potential entry or exit points in crypto trading.
Mastering Candlestick Charts and Patterns
Candlestick charts offer a detailed visual representation of price movements. Understanding their structure, key patterns, and signals helps traders identify trends and anticipate market shifts, especially in pairs like BTC/USDT.
Anatomy of a Candlestick
A candlestick displays four key prices: open, close, high, and low within a specific time frame. The body shows the range between open and closed, while the wicks (or shadows) indicate the high and low points.
A green candle means the closing price was higher than the opening price, signaling buying pressure. A red candle means the opposite, showing selling pressure.
Traders pay attention to the size and position of the body and wicks to gauge market sentiment. Long bodies imply strong momentum, while long wicks can indicate rejection of price levels or potential reversals.
Essential Candle Patterns
Candlestick patterns are formations that indicate possible future price movements. Common bullish patterns include hammer, bullish engulfing, and morning star, which suggest upward momentum.
Bearish patterns like shooting star, bearish engulfing, and evening star point to potential price declines. Recognizing these patterns near support and resistance levels enhances their reliability.
Patterns must be considered in context with the trend direction. For example, a bullish engulfing pattern within a downtrend could hint at a trend reversal to the upside.
Reading Trend Reversals and Breakouts
Trend reversals signal a change from a bullish trend to a bearish trend or vice versa. Patterns such as head and shoulders and double tops often mark tops, indicating a shift toward price decreases.
Triangles are consolidation patterns that precede breakouts. When the price crosses resistance levels or breaks through support, it often leads to a strong move, known as a price breakout.
Trading pairs like BTC/USDT respond to these signals by showing clearer momentum shifts. Confirming breakouts with volume increases adds confidence to the pattern recognition process.
Key Technical Analysis Tools and Indicators
Technical analysis relies on specific tools and indicators to interpret price movements, volume, and market trends. These elements provide insights into trend direction, momentum, and potential price reversals, helping traders make informed decisions.
Moving Averages: SMA and EMA
Moving averages smooth out price data to identify trend direction and reduce noise. The Simple Moving Average (SMA) calculates the average price over a set period, equally weighting each data point. It is useful for spotting longer-term trend changes.
The Exponential Moving Average (EMA) gives more weight to recent prices, making it more responsive to current market conditions. EMA is preferred for capturing trend shifts faster, especially in volatile markets. Traders often observe price crossing above or below these averages to gauge buying or selling pressure.
Momentum Indicators: RSI and MACD
The Relative Strength Index (RSI) measures the speed and change of price movements on a scale from 0 to 100. Values above 70 typically indicate overbought conditions, while values below 30 suggest oversold levels. RSI helps assess if a price trend might reverse or continue.
The Moving Average Convergence Divergence (MACD) tracks the relationship between two EMAs, showing momentum shifts. When the MACD line crosses above the signal line, it signals bullish momentum; crossing below indicates bearish momentum. MACD also highlights divergence between price and momentum, useful for detecting weakening trends.
Volume Analysis and OBV
Volume bars display the number of coins or tokens traded during a period, reflecting market participation and the strength of price moves. High volume confirms strong buying or selling pressure, while low volume might suggest weak or indecisive moves.
On-Balance Volume (OBV) accumulates volume based on price direction, rising when prices close higher and falling when lower. OBV acts as a volume-based confirmation tool to validate price trends. Divergences between OBV and price levels can signal potential reversals or trend continuations.
Support, Resistance, and Trendlines
Support refers to price levels where buying interest typically prevents further decline. Resistance marks price points where selling pressure may halt upward movement. Identifying these levels helps traders anticipate potential price bounce or breakout zones.
Trendlines connect successive lows in an uptrend or highs in a downtrend, visually defining trend direction and strength. They assist in trend analysis, showing whether the price is maintaining or breaking a trend. Combining trendlines with support and resistance improves precision in spotting key price levels.
Applying Chart Analysis to Confident Trading
Successful trading depends on clear strategies, understanding risk limits, and practicing in controlled environments. Mastering these areas helps traders interpret charts with precision and make informed decisions.
Developing a Trading Strategy
A solid trading strategy outlines when to enter or exit trades based on chart signals. Traders often choose between day trading and swing trading, depending on their risk tolerance and time availability.
Day traders focus on short timeframes, watching trading volume and current price movements to capitalize on quick fluctuations. Swing traders analyze historical price movement to identify trends that last days or weeks.
Key elements include defining trading pairs, setting entry points using support and resistance levels, and deciding on profit targets. Consistency in applying the strategy is essential to minimize emotional decisions.
Risk Management Essentials
Risk management limits potential losses and protects capital during volatile market shifts. Using a stop-loss order is vital; it automatically sells assets at a predetermined price to prevent deeper losses.
Traders should risk only a small percentage of their capital on each trade—commonly 1-2%—to ensure sustainability. Monitoring trading volume alongside price changes can signal potential reversals, allowing adjustments to risk controls.
Proper risk management balances potential rewards with defined limits to avoid large, unexpected drawdowns in any trading session.
Using Demo Accounts for Practice
Demo accounts simulate real trading without financial risk. They allow traders to apply chart analysis and test strategies on live data from cryptocurrency exchanges.
Using a demo platform helps users understand how price, volume, and order books interact. It builds familiarity with tools like candlestick charts, volume indicators, and timeframes.
Practicing in a demo account improves decision-making speed and confidence before real capital is involved. It also gives insight into how market conditions vary across different trading pairs.